Technical walkthrough ·
OpenKline: replay candles in vanilla JavaScript, React and Vue
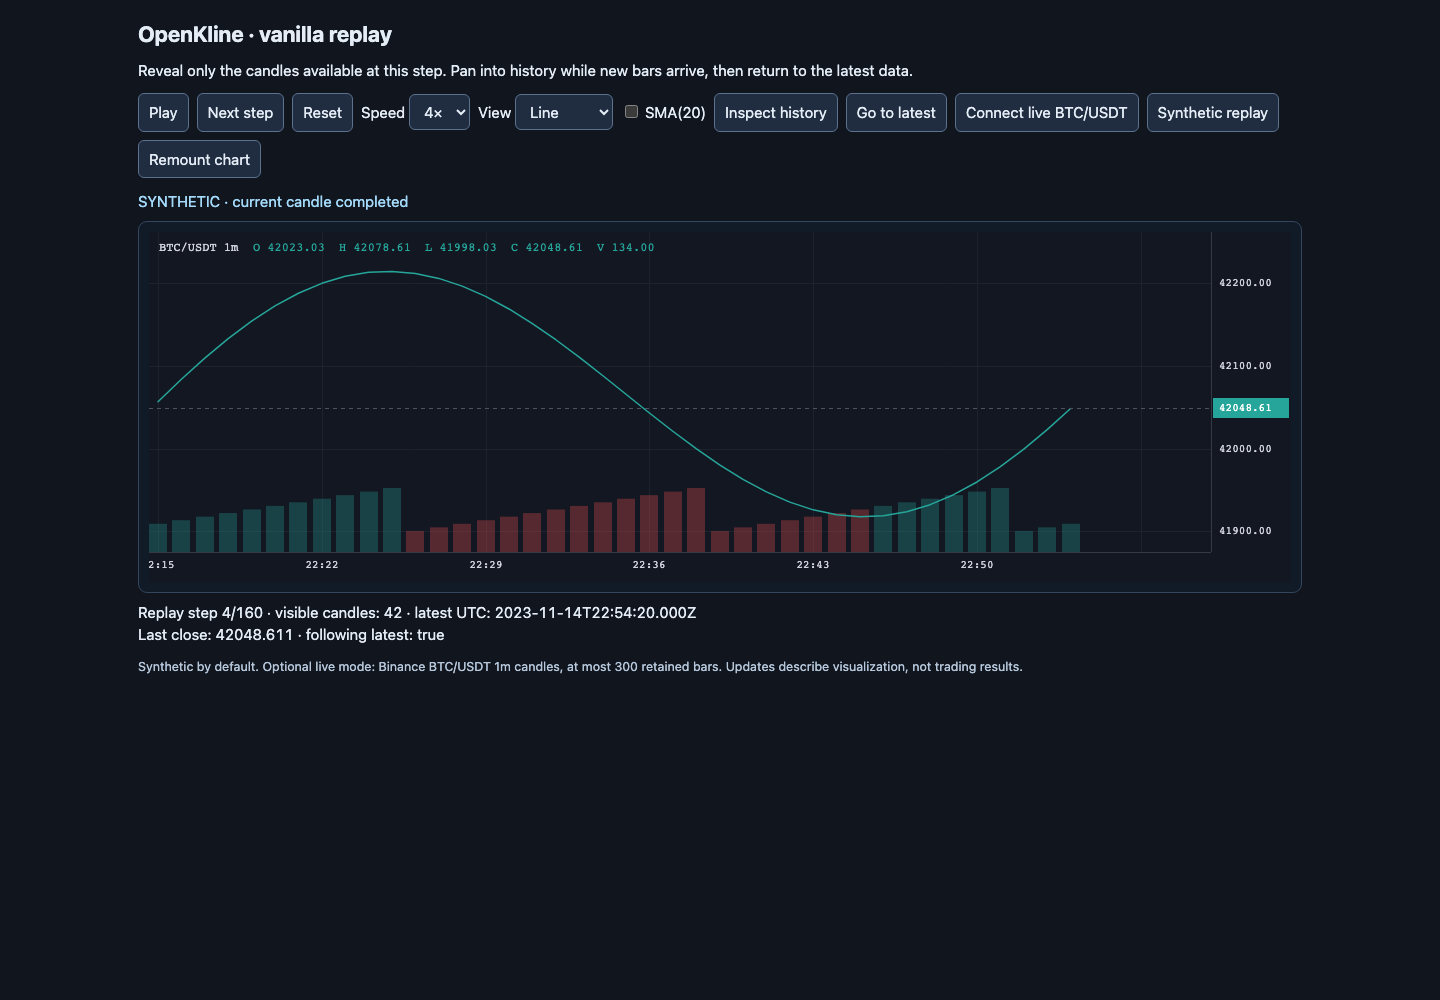
Press Next step twice. The first click adds a forming candle; the second changes that candle’s close and volume without adding another bar. Then try Inspect history and keep stepping: the view stays where you left it.
The Vanilla, React and Vue tabs run the same sequence through OpenKline core 0.2.0. The wrappers are version 0.1.0. All prices in the replay are synthetic.
Choose a framework
One candle, two updates
The replay opens with 40 one-minute candles. A new minute arrives in two steps:
| Step | What changes | Visible candles |
|---|---|---|
| Start | Initial history | 40 |
| 1 | A forming candle is added | 41 |
| 2 | That candle receives its final values | 41 |
| 3 | The following minute starts | 42 |
The timestamp identifies the candle. An update for the current timestamp replaces its values; a later timestamp starts another bar. Appending every update would turn one minute into several candles.
Play runs this sequence at 1× or 4× speed. Reset returns to the first 40 candles. Only the revealed prefix is passed to the chart, so SMA(20) cannot use prices from later in the replay.
This makes a small teaching tool: pause a candle halfway through, inspect it, then finish it. It also gives a UI test a fixed input. All three integrations should end a step with the same candle count and close, regardless of how the framework schedules rendering.
Keep your place in history
A chart used for reviewing an earlier move still needs to accept new data. Select Inspect history, then advance a few steps. Go to latest restores following when you are finished looking back.
The example uses updateLastCandle for incoming candles. Full snapshots go through setData with view preservation. In the wrappers, full datasets arrive through the component’s data prop; refs expose imperative updates and navigation.
Try changing Candles to Line, toggling SMA, or pressing Remount chart. Remount resets the example, disposes of the old chart and stops its playback or feed. Switching framework tabs removes the previous iframe entirely. The vanilla tab loads neither React nor Vue.
Hook up a feed
OpenKline expects candles with o, h, l, c, v and t fields. Here t is Unix time in seconds. Binance sends milliseconds, so the adapter divides its timestamp by 1,000.
Connect live BTC/USDT loads recent one-minute candles over REST and buffers WebSocket updates until that history is ready. Afterward, matching timestamps update the last candle, newer ones append and older ones are ignored. The example retains up to 300 bars.
A disconnected feed is marked stale. Reconnection waits are 1, 2, 4, 8, 16 and 30 seconds, with a fresh history request on each connection. After six attempts, automatic retries stop. Returning to Synthetic replay closes the connection and restores the sample sequence.
The status uses local receipt time, not an exchange-latency measurement. This short rolling history is enough for the demo; storing a complete archive or recovering every tick needs a separate data pipeline. The replay is not a backtest.
Public endpoints · Kline message format
Use the examples
The source sections below contain the entry points for core, React and Vue. They share the replay controller and sample data. The lockfile pins React 19 and Vue 3.5 alongside the published OpenKline packages.
With Node 24.20 or newer in the 24.x series:
git clone https://github.com/rekurt/rekurt.github.io.git
cd rekurt.github.io/site
npm ci
npm run build
npm run dev
Open /articles/openkline-replay-react-vue/. Tests exercise the replay sequence, time conversion, historical view, remounting and simulated feed failures on desktop and mobile. A separate browser check confirmed that real market data reached the example.
Core 0.2.0 was released on October 9, 2026.
Written with AI assistance.
Example code
Vanilla · core.ts
View core.ts in the repository
import { OHLCVChart } from "@rekurt/openkline-core";
import { candleApp } from "./candle-app";
candleApp("vanilla", (container, data) => {
  const chart = new OHLCVChart({
    container,
    symbol: "BTC/USDT",
    resolution: "1m",
    theme: "dark",
  });
  chart.setData(data);
  chart.setIndicatorConfigs([{ type: "sma", period: 20 }]);
  return {
    replace: (d) => chart.setData(d, { preserveView: true }),
    update: (c) => chart.updateLastCandle(c),
    type: (t) => chart.setChartType(t),
    sma: (enabled) =>
      chart.setIndicatorConfigs(enabled ? [{ type: "sma", period: 20 }] : []),
    chart: () => chart,
    destroy: () => chart.destroy(),
  };
});
React · react.tsx
View react.tsx in the repository
import { createRef } from "react";
import { createRoot } from "react-dom/client";
import { flushSync } from "react-dom";
import { OHLCVChart, type OHLCVChartRef } from "@rekurt/openkline-react";
import type {
  Candle,
  ChartType,
  IndicatorConfig,
} from "@rekurt/openkline-core";
import { candleApp } from "./candle-app";
candleApp("React", (container, initial) => {
  const root = createRoot(container),
    ref = createRef<OHLCVChartRef>();
  let data: Candle[] = initial,
    type: ChartType = "candles",
    indicators: IndicatorConfig[] = [{ type: "sma", period: 20 }];
  const render = () =>
    flushSync(() =>
      root.render(
        <OHLCVChart
          ref={ref}
          symbol="BTC/USDT"
          resolution="1m"
          theme="dark"
          data={data}
          chartType={type}
          indicators={indicators}
          style={{ height: "100%" }}
        />,
      ),
    );
  render();
  return {
    replace: (d) => {
      data = d;
      render();
    },
    update: (c) => ref.current?.updateLastCandle(c),
    type: (t) => {
      type = t;
      render();
    },
    sma: (enabled) => {
      indicators = enabled ? [{ type: "sma", period: 20 }] : [];
      render();
    },
    chart: () => ref.current?.chart ?? null,
    destroy: () => flushSync(() => root.unmount()),
  };
});
Vue · vue.ts
import { createApp, defineComponent, h, shallowRef } from "vue";
import { OHLCVChart } from "@rekurt/openkline-vue";
import type {
  Candle,
  ChartType,
  IndicatorConfig,
  OHLCVChart as CoreChart,
} from "@rekurt/openkline-core";
import { candleApp } from "./candle-app";
candleApp("Vue", (container, initial) => {
  const data = shallowRef<Candle[]>(initial),
    type = shallowRef<ChartType>("candles"),
    indicators = shallowRef<IndicatorConfig[]>([{ type: "sma", period: 20 }]);
  let exposed: {
    chart: CoreChart | null;
    updateLastCandle: (c: Candle) => void;
  } | null = null;
  const app = createApp(
    defineComponent({
      setup: () => () =>
        h(OHLCVChart, {
          ref: (value: unknown) => {
            exposed = value as typeof exposed;
          },
          symbol: "BTC/USDT",
          resolution: "1m",
          theme: "dark",
          data: data.value,
          chartType: type.value,
          indicators: indicators.value,
        }),
    }),
  );
  app.mount(container);
  return {
    replace: (d) => {
      data.value = d;
    },
    update: (c) => exposed?.updateLastCandle(c),
    type: (t) => {
      type.value = t;
    },
    sma: (enabled) => {
      indicators.value = enabled ? [{ type: "sma", period: 20 }] : [];
    },
    chart: () => exposed?.chart ?? null,
    destroy: () => app.unmount(),
  };
});